Overview
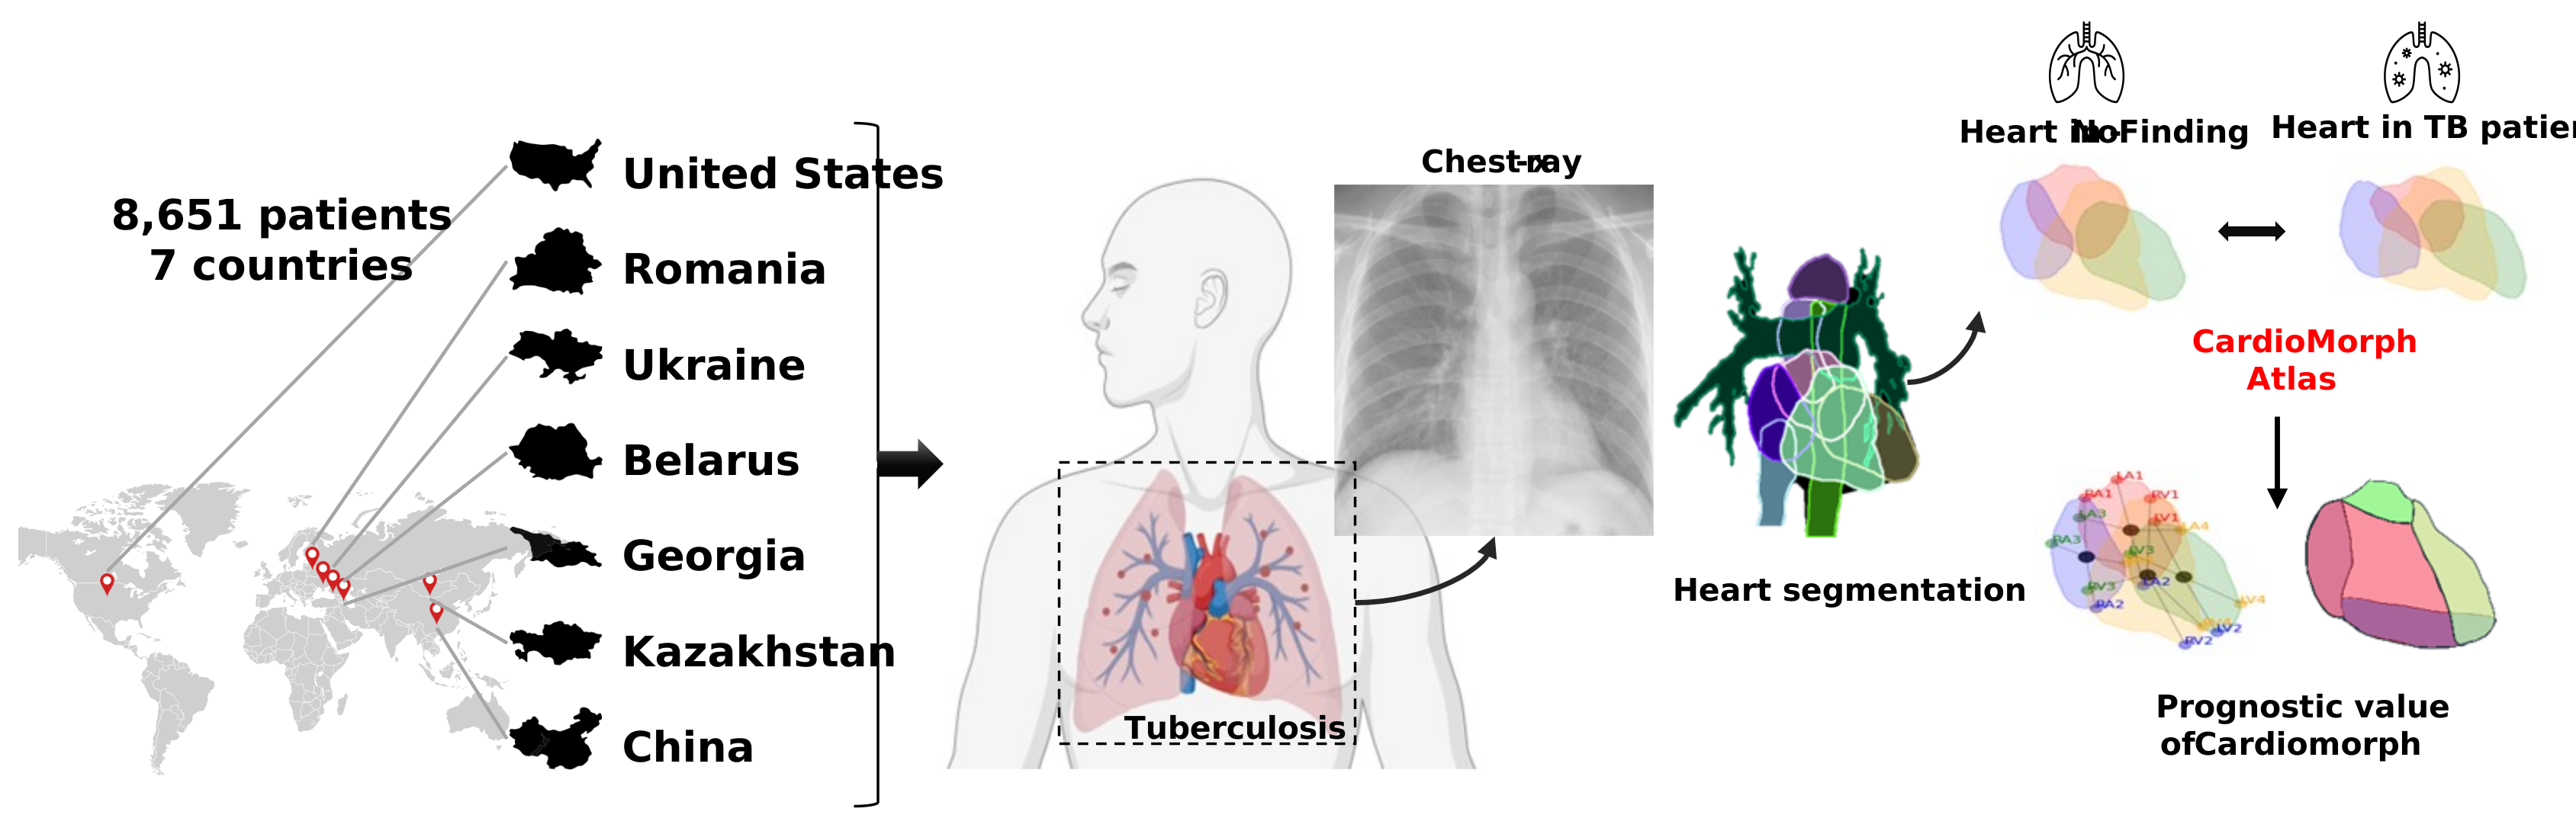
Fig. 1 — Creation of the CardioMorph Atlas: cardiac substructures are segmented from routine chest X-rays and aligned into a population-level template used to detect morphological changes associated with tuberculosis.
Background Patients with tuberculosis (TB) face an elevated risk of certain cardiovascular diseases. The inflammatory response associated with TB is linked to cardiac complications, though the spatial impact on cardiac structure remains understudied. In this study, we assess population-level differences in cardiac morphology in TB using an atlas-based approach applied to routine chest X-rays.
Methods A total of 8651 patients (with 2626 patients with TB) were selected from four cohorts: Shenzhen, TBX11K, TB Portals, and MIMIC, covering seven countries. We developed a representative cardiac template, the CardioMorph Atlas, and compared population-level morphological differences between patients with TB and controls. Cardiac borders and areas were quantified into CardioMorph features and analysed for their association with all-cause mortality using Cox regression.
Findings CardioMorph Atlas revealed significant lateral elongation of the heart in patients with TB, in both left and right ventricles, with patterns distinct from those in pneumonia and cardiomegaly. Vector field analysis showed lateral extension of cardiac structures in patients with TB. Upper area (hazard ratio: 2.18, 95% CI: 1.10–4.30, p = 0.022) and right perimeter (HR = 2.07, 95% CI: 1.06–4.02) were significantly associated with increased all-cause mortality in patients with TB.
Interpretation These findings suggest that tuberculosis is linked to distinct, prognostically relevant cardiac morphological alterations detectable on routine chest X-rays using the CardioMorph Atlas. Further prospective validation is warranted.
Fig. 1 — Creation of the CardioMorph Atlas: cardiac substructures are segmented from routine chest X-rays and aligned into a population-level template used to detect morphological changes associated with tuberculosis.
Tuberculosis is the leading infectious cause of death worldwide — more than 10 million people develop active TB every year, and about a million die from it. TB is usually thought of as a lung disease, but roughly 60% of patients with TB show some form of cardiovascular involvement, and population studies have found TB survivors face a substantially higher long-term risk of cardiovascular disease, including a reported 51% higher rate of major adverse cardiac events after TB. How TB actually reshapes the heart, however, has been hard to study at scale: the imaging tools that can resolve fine cardiac structure — cardiac MRI and CT — are expensive, require specialist expertise, and are least available in the very regions where TB is most common.
Chest X-rays, by contrast, are cheap, fast, and already recommended by the WHO as a front-line TB screening tool — but they have mostly been used to look at the lungs, not the heart. CardioMorph Atlas asks whether the cardiac silhouette already visible on a routine chest X-ray carries a measurable, population-level signature of TB's effect on the heart. By building a statistical shape atlas from 8,651 chest X-rays across four international cohorts spanning seven countries, we show that it does: TB is associated with a distinct, diffuse lateral elongation of the heart that is measurable on the same X-ray already being taken for TB screening, and that this cardiac signature carries independent prognostic information for all-cause mortality. That makes cardiac morphometry a candidate for a essentially free, opportunistic risk-stratification signal in exactly the resource-limited, high TB-burden settings where advanced cardiac imaging isn't an option.
Research in context
Evidence before this study
Prior work on TB and the heart focused on direct cardiac involvement — pericarditis, myocardial infection, constrictive pericarditis — mostly via case reports or small series using MRI, CT or PET/CT. No large-scale study had systematically mapped subtle, population-level cardiac shape changes from routine chest X-rays.
Added value of this study
Across 8,651 chest X-rays from four cohorts, pulmonary TB without direct cardiac infection is associated with measurable cardiac remodelling — lateral elongation of both ventricles — captured by CardioMorph and independently associated with all-cause mortality.
Implications
TB may have systemic cardiovascular consequences even without direct heart infection. Morphometric analysis of routine chest X-rays could enable early detection of cardiac remodelling and improve risk stratification in TB care and public health screening.
The study pools 8,651 patients (2,626 with active TB) from four publicly available, de-identified cohorts covering seven countries:
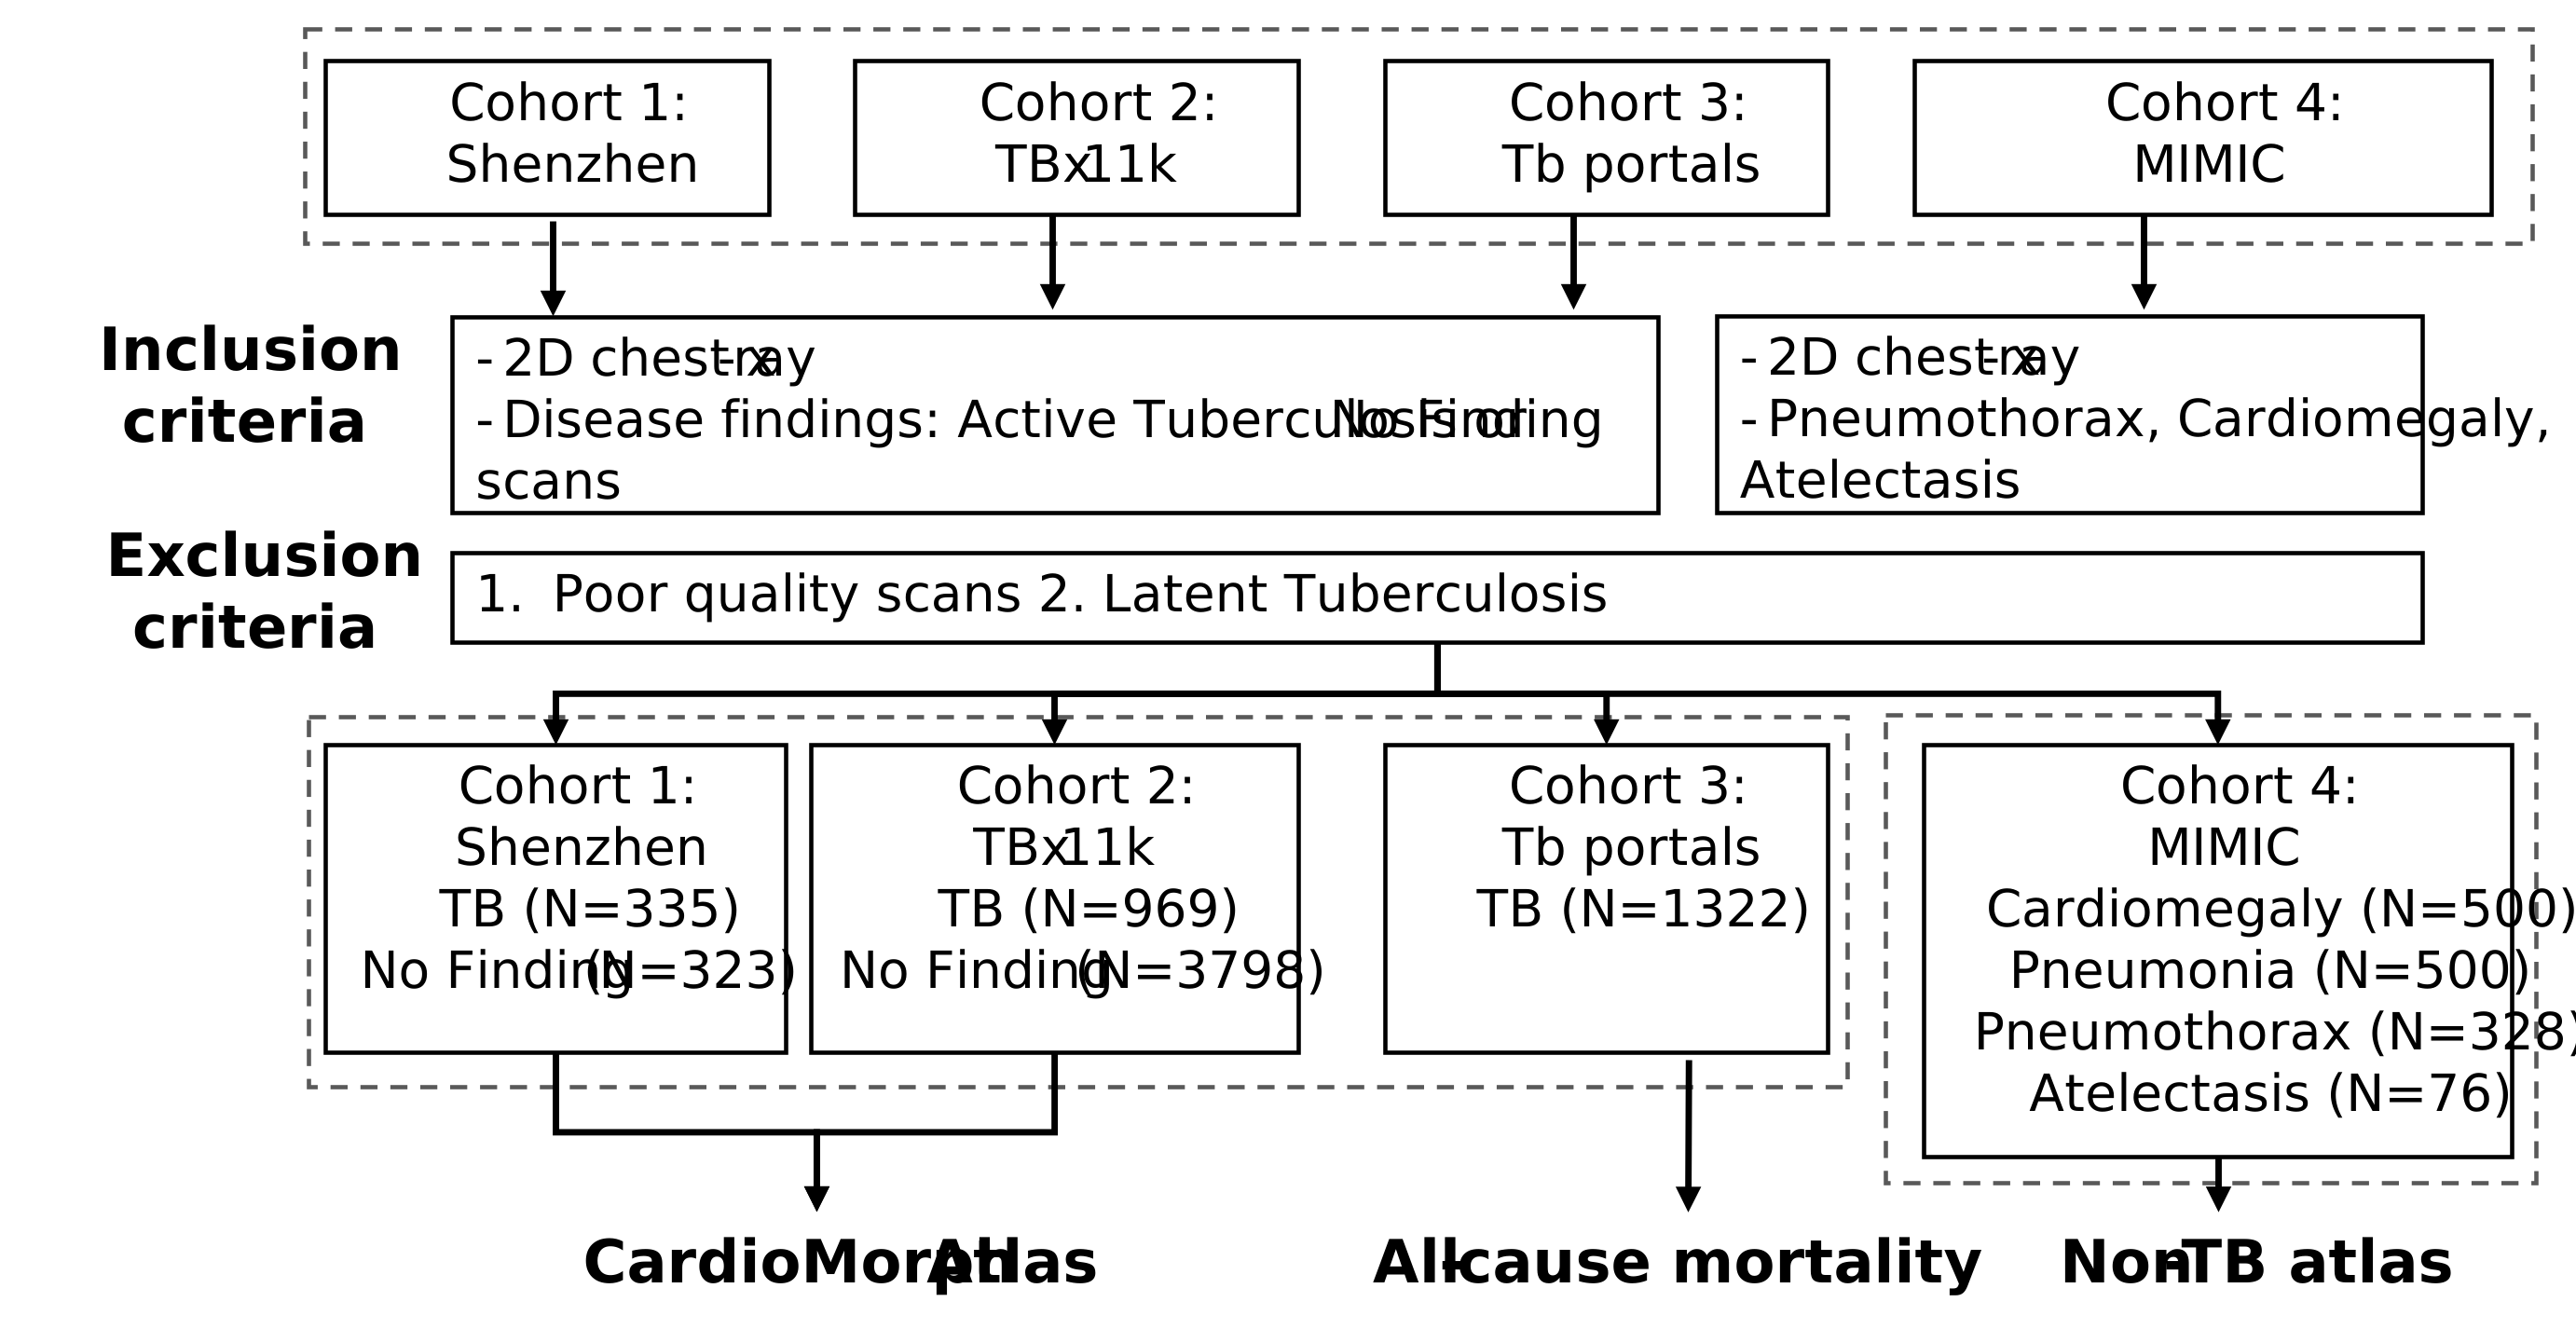
Fig. 2 — Cohort diagram with inclusion and exclusion criteria for atlas creation and the all-cause mortality analysis.
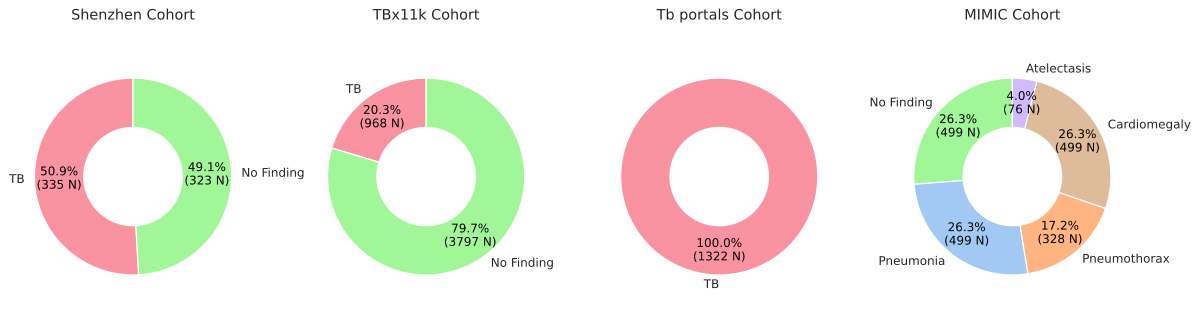
Fig. 3 — Patient scan counts and disease-category distribution across the four datasets.
Heart chambers and lung fields are first segmented on each chest X-ray using a pre-trained anatomy segmentation model, then cropped to the thoracic cavity and standardised to 512×512 pixels. A representative cardiac template is chosen from the control cohort (median heart area) as the reference frame. Every scan is registered to this template — rigid registration followed by affine registration — achieving a DICE score of 0.841 for heart-to-heart alignment. Binary heart-chamber masks are converted to signed distance functions, and TB-vs-control differences are quantified voxel-wise with GLM-based t-tests, permutation testing (500 permutations), and multiple-comparison correction — producing a statistical difference atlas that highlights only the shape differences that survive population-level correction.
A complementary displacement vector field analysis aligns TB and control heart contours via B-spline transformation and averages the resulting displacement vectors within a polar grid, mapping the direction and magnitude of regional cardiac deformation. Finally, four landmark points per heart chamber are used to derive CardioMorph features — border perimeters and regional areas (upper, anterior, inferior, left, right) — which serve as compact, interpretable 2D morphology proxies for group comparison (Wilcoxon rank-sum test) and for the Cox regression mortality analysis.
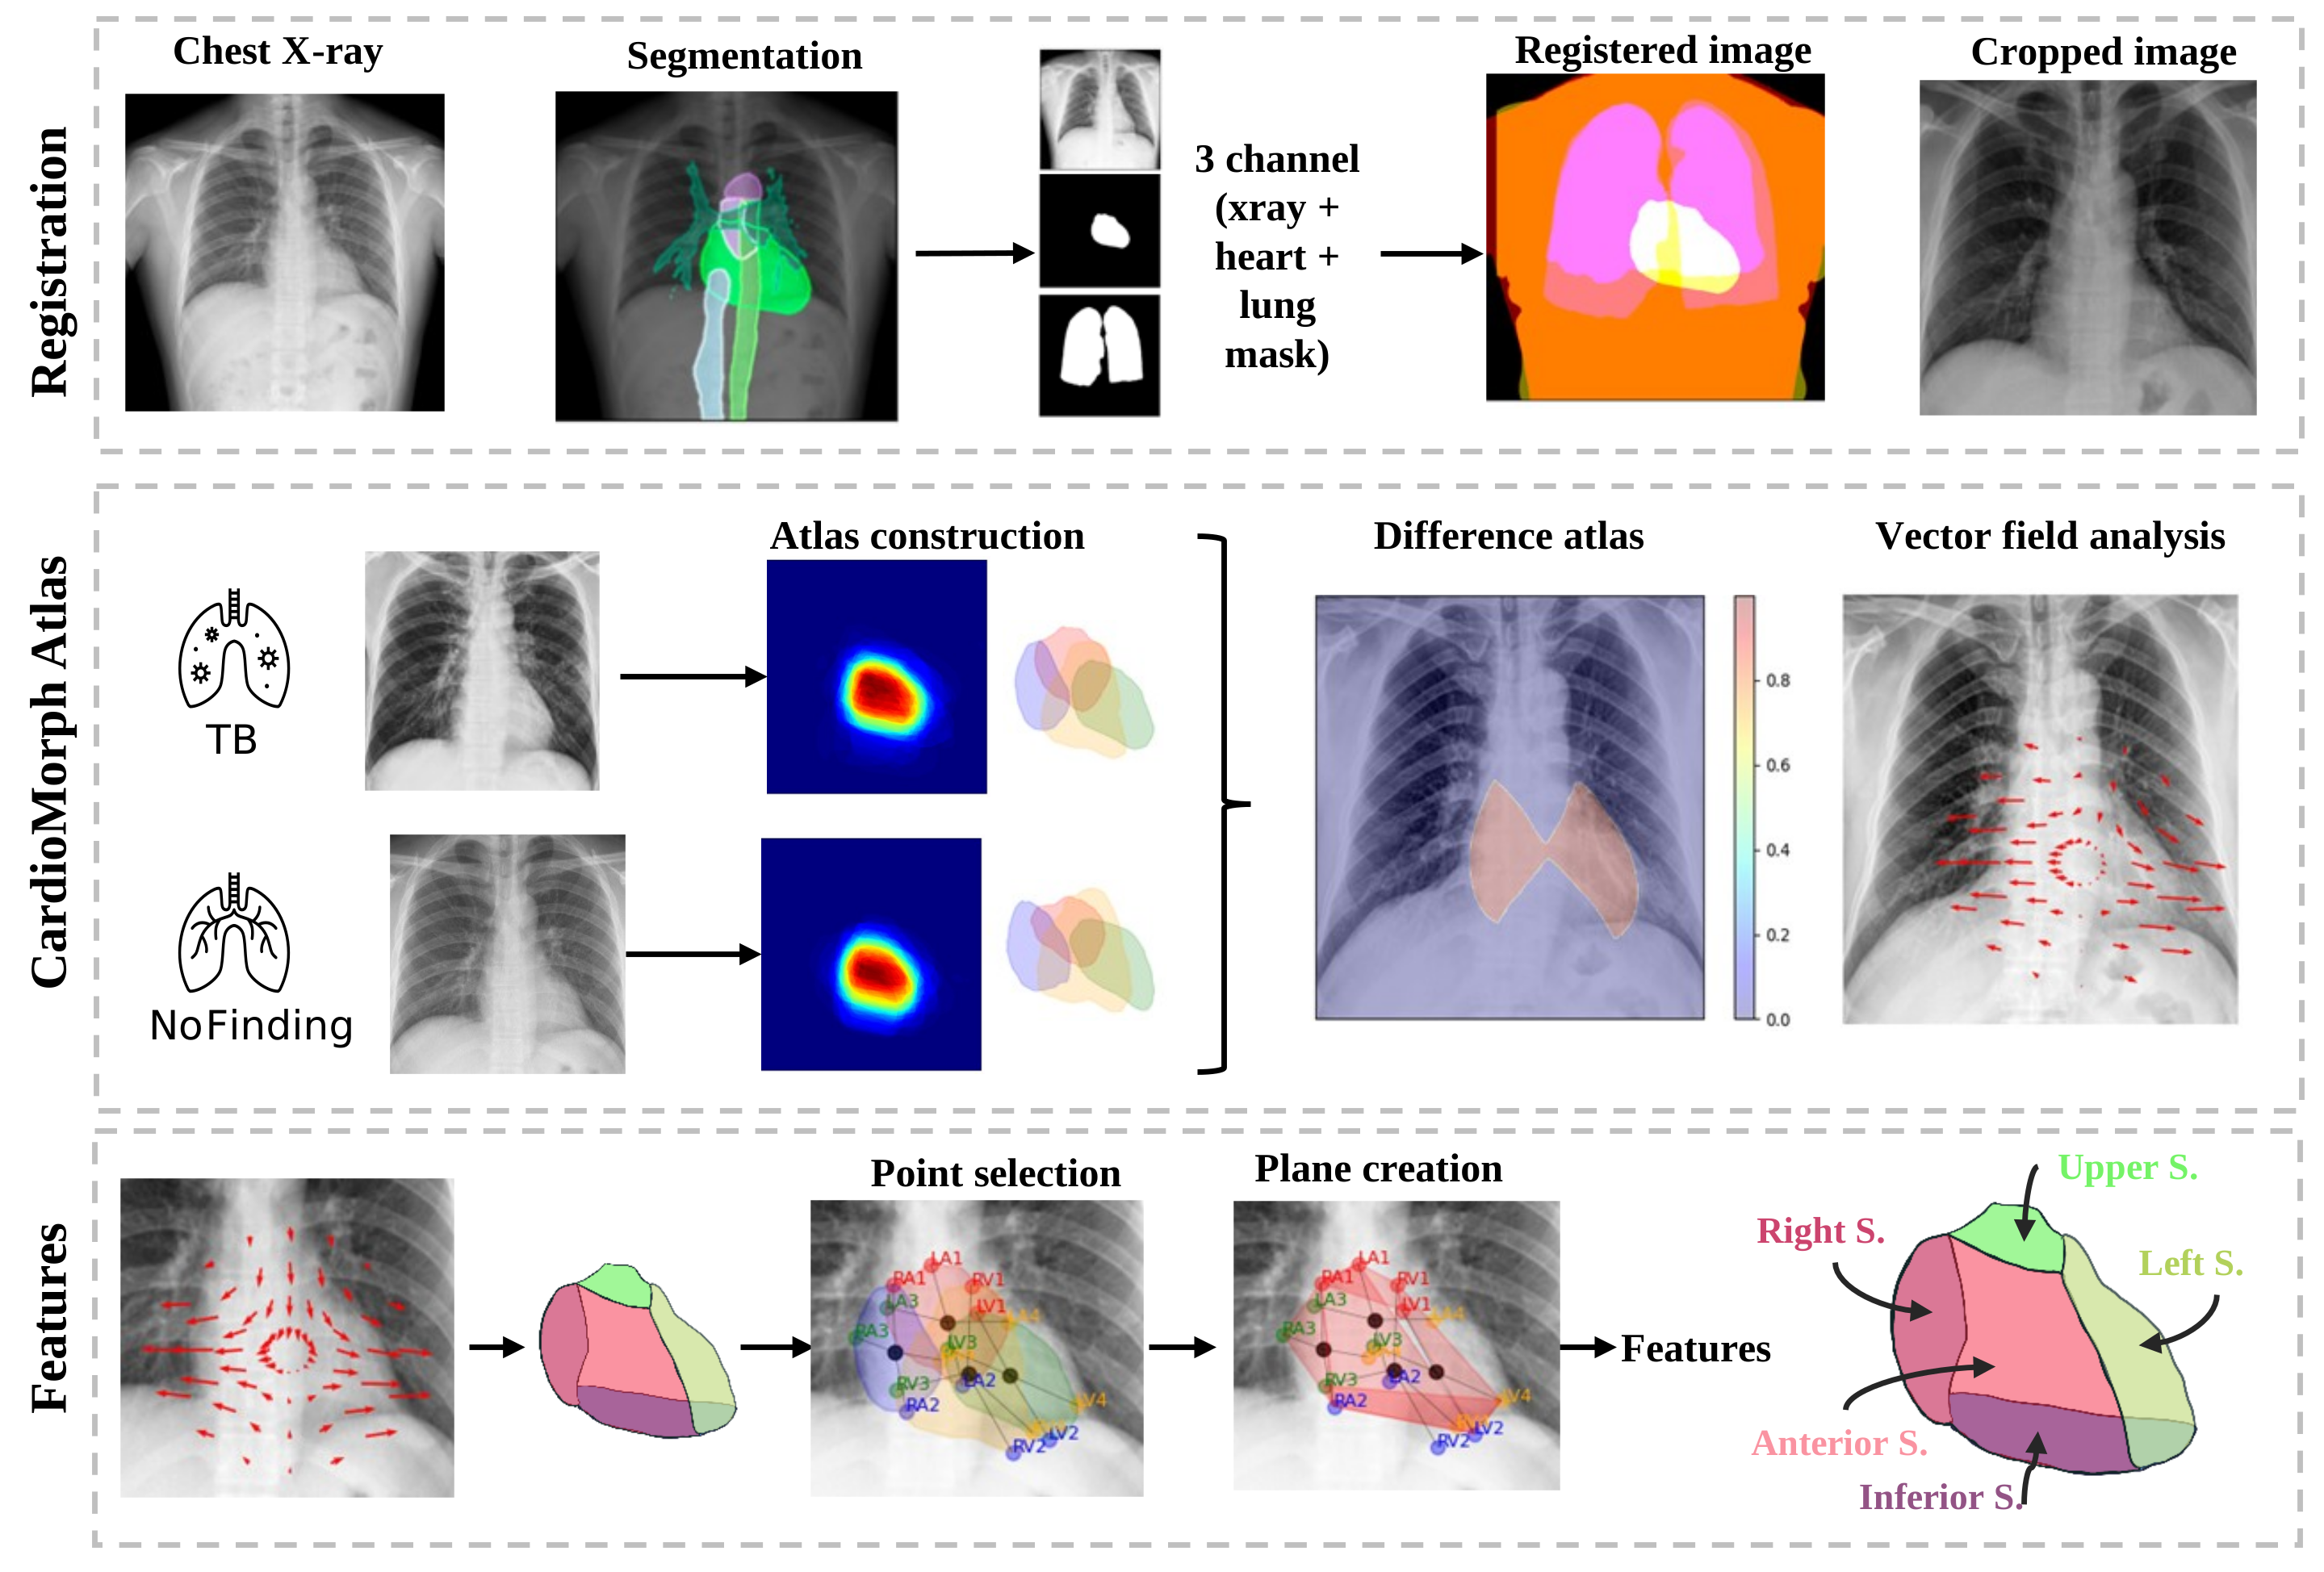
Fig. 4 — Workflow: segmentation → registration → population-level difference atlas & vector-field analysis → per-patient CardioMorph border/area features.
The difference atlas shows multiple regions of significant morphological difference concentrated along the lateral borders of the heart in both the Shenzhen and TBX11K datasets. Vector field analysis confirms this: displacement vectors from control to TB point consistently outward and laterally, indicating an overall widening of the cardiac silhouette that affects both ventricles, not just the left as in classic cardiomegaly.
To test whether this pattern is TB-specific, the same analysis was repeated for pneumonia, atelectasis, pneumothorax, and cardiomegaly in the MIMIC cohort. Pneumonia, atelectasis, and pneumothorax showed only small, randomly-oriented displacement vectors — even though pneumothorax and atelectasis can cause mediastinal shift, they did not produce a directional cardiac signal here. Cardiomegaly showed vectors pointing toward the left-ventricular apex, matching its classic, localised enlargement pattern. TB's diffuse, bilateral, larger-magnitude lateral displacement is distinct from all four comparators.
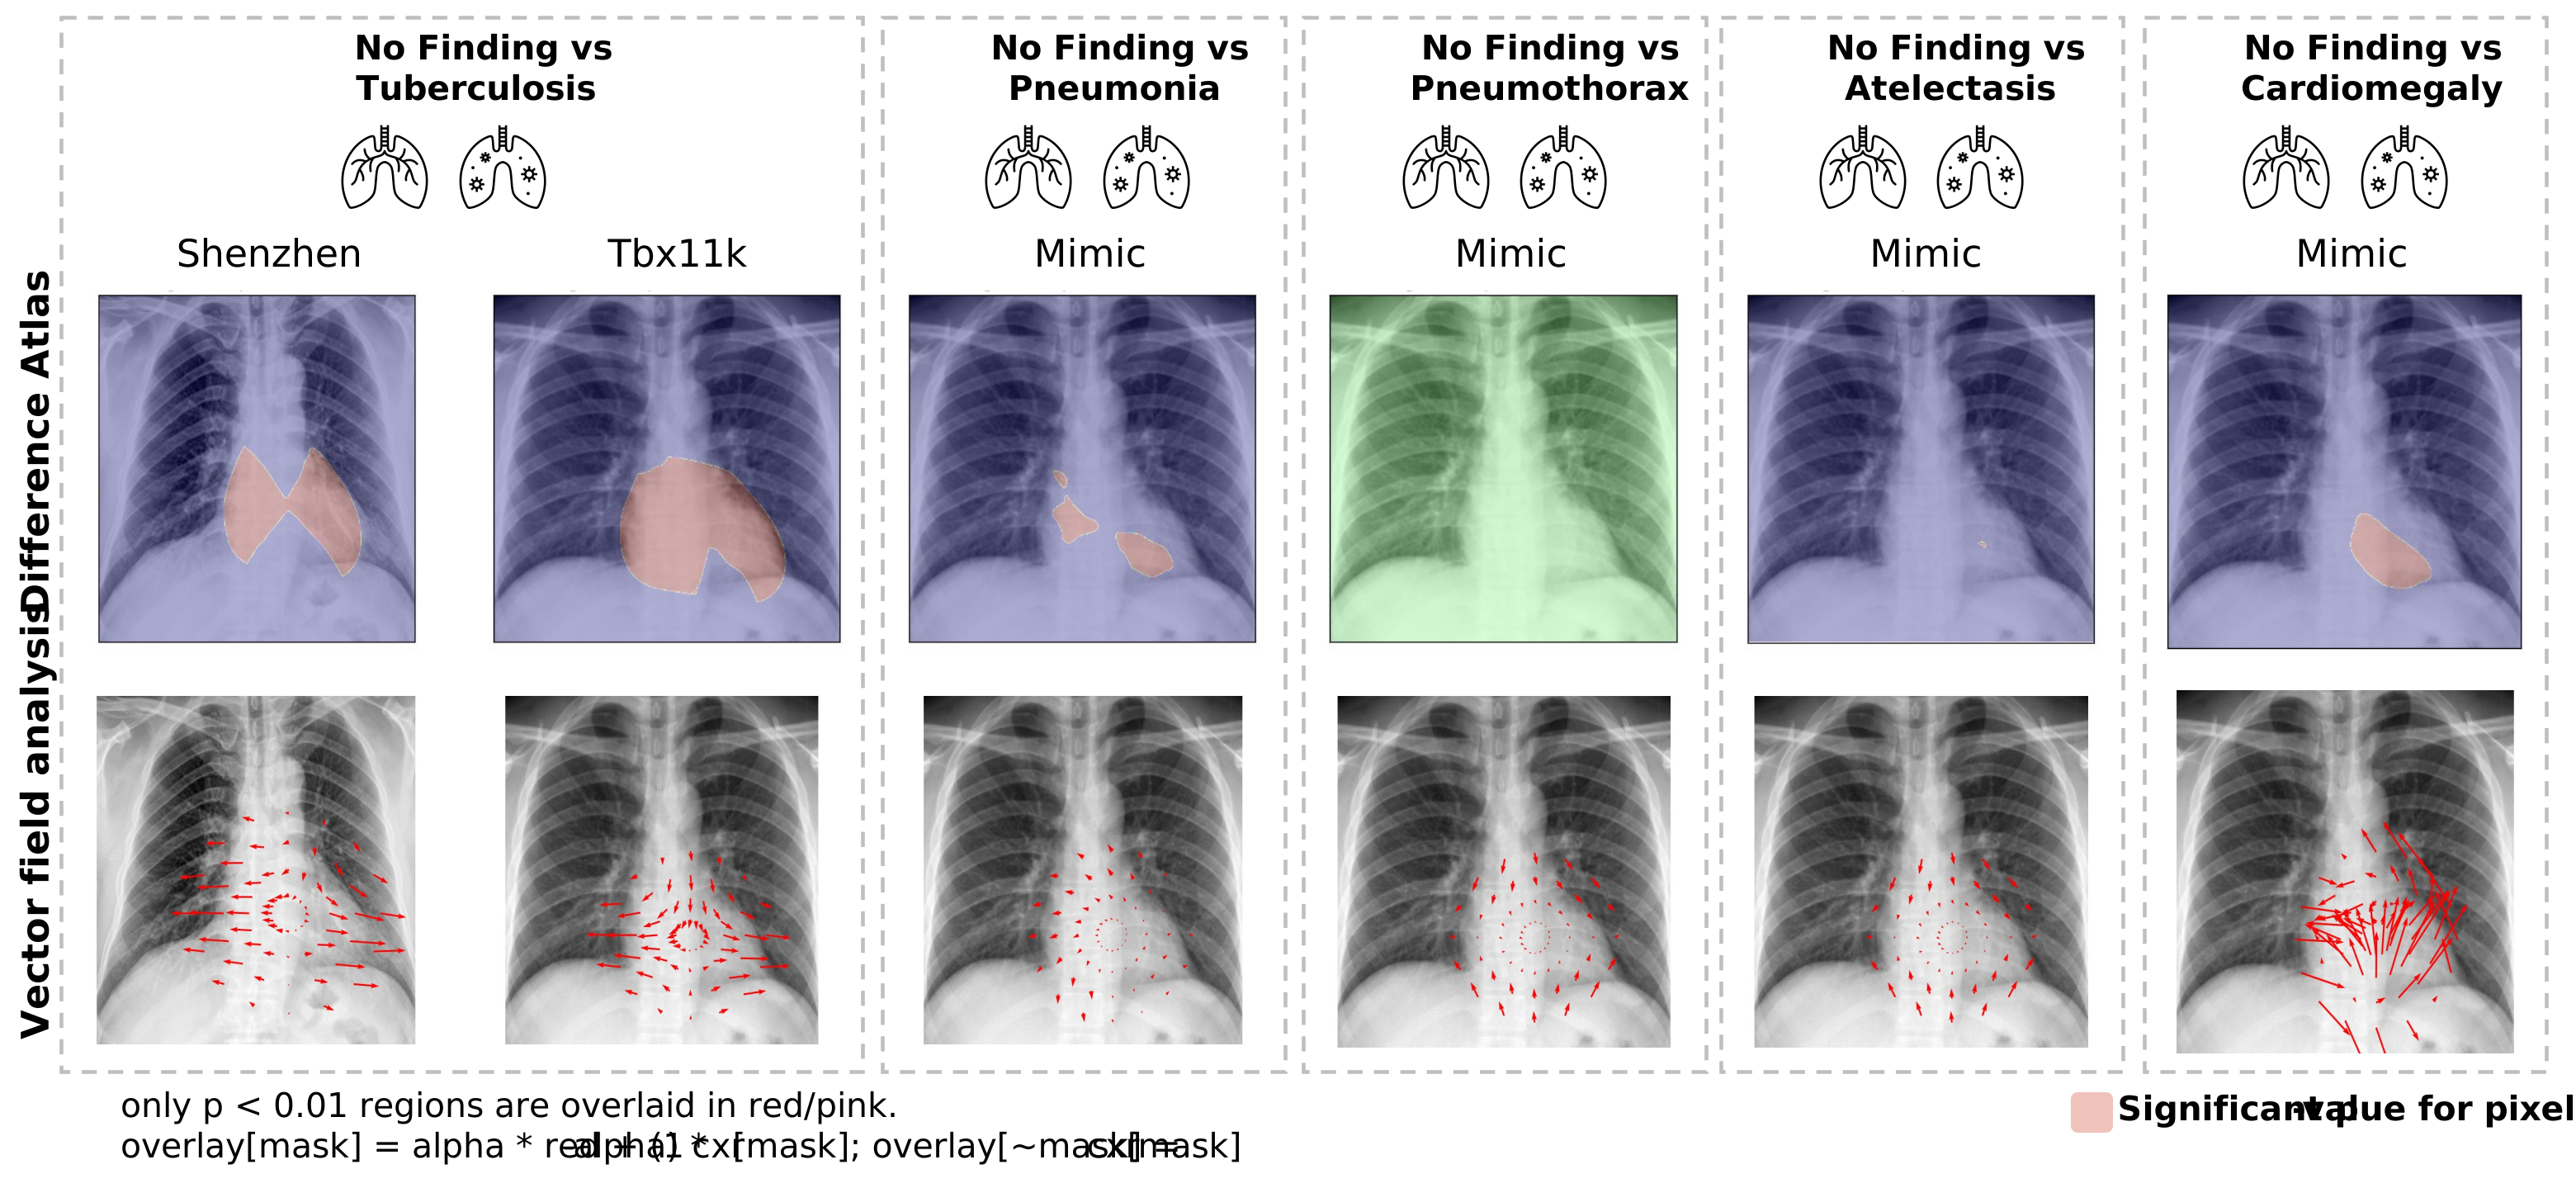
Fig. 5 — Difference atlas (top) and vector-field analysis (bottom) for TB vs. pneumonia, pneumothorax, atelectasis, and cardiomegaly. Red/pink overlay marks pixels with a statistically significant shape difference (p < 0.01, permutation-corrected); arrows show the direction and magnitude of local cardiac displacement.
| Feature class | Region | Cohort 1 (Shenzhen) | Cohort 2 (TBX11K) |
|---|---|---|---|
| Area | Upper | 0.249 | <0.001 |
| Anterior | <0.001 | <0.001 | |
| Inferior | 0.841 | <0.001 | |
| Left | <0.001 | <0.001 | |
| Right | <0.001 | <0.001 | |
| Perimeter | Upper | 0.37 | 0.352 |
| Anterior | <0.001 | <0.001 | |
| Inferior | <0.001 | <0.001 | |
| Left | <0.001 | <0.001 | |
| Right | 0.019 | <0.001 |
Left border length and left cardiac area were consistently larger in TB than in controls across both datasets (p < 0.001), consistent with left-heart enlargement possibly driven by ventricular hypertrophy or increased workload on the left ventricle.
In the TB Portals cohort (1,322 patients with active TB), patients were split into CardioMorph-positive (CM+) and CardioMorph-negative (CM−) groups by the population median of each feature, and outcomes assessed with a 6-month landmark Kaplan–Meier and Cox regression analysis. CM+ patients had significantly higher all-cause mortality than CM− patients.
Upper area ↑ risk
HR 2.18
95% CI 1.10–4.30, p = 0.022
Upper perimeter ↑ risk
HR 2.07
95% CI 1.06–4.02, p = 0.029
Right perimeter ↓ risk
HR 0.42
95% CI 0.21–0.84, p = 0.011
Increased upper area and increased upper perimeter predicted higher all-cause mortality — potentially reflecting aortic root dilation or cardiac strain — while a decreased right perimeter was linked to lower mortality risk, possibly indicating reduced remodelling or pulmonary hypertension. These associations remained significant after adjusting for age, sex, BMI, country of origin, HIV status, drug resistance, Hepatitis C status, diabetes, TB site, and lung localisation — indicating the prognostic signal is not simply explained by disease severity or comorbidity burden.
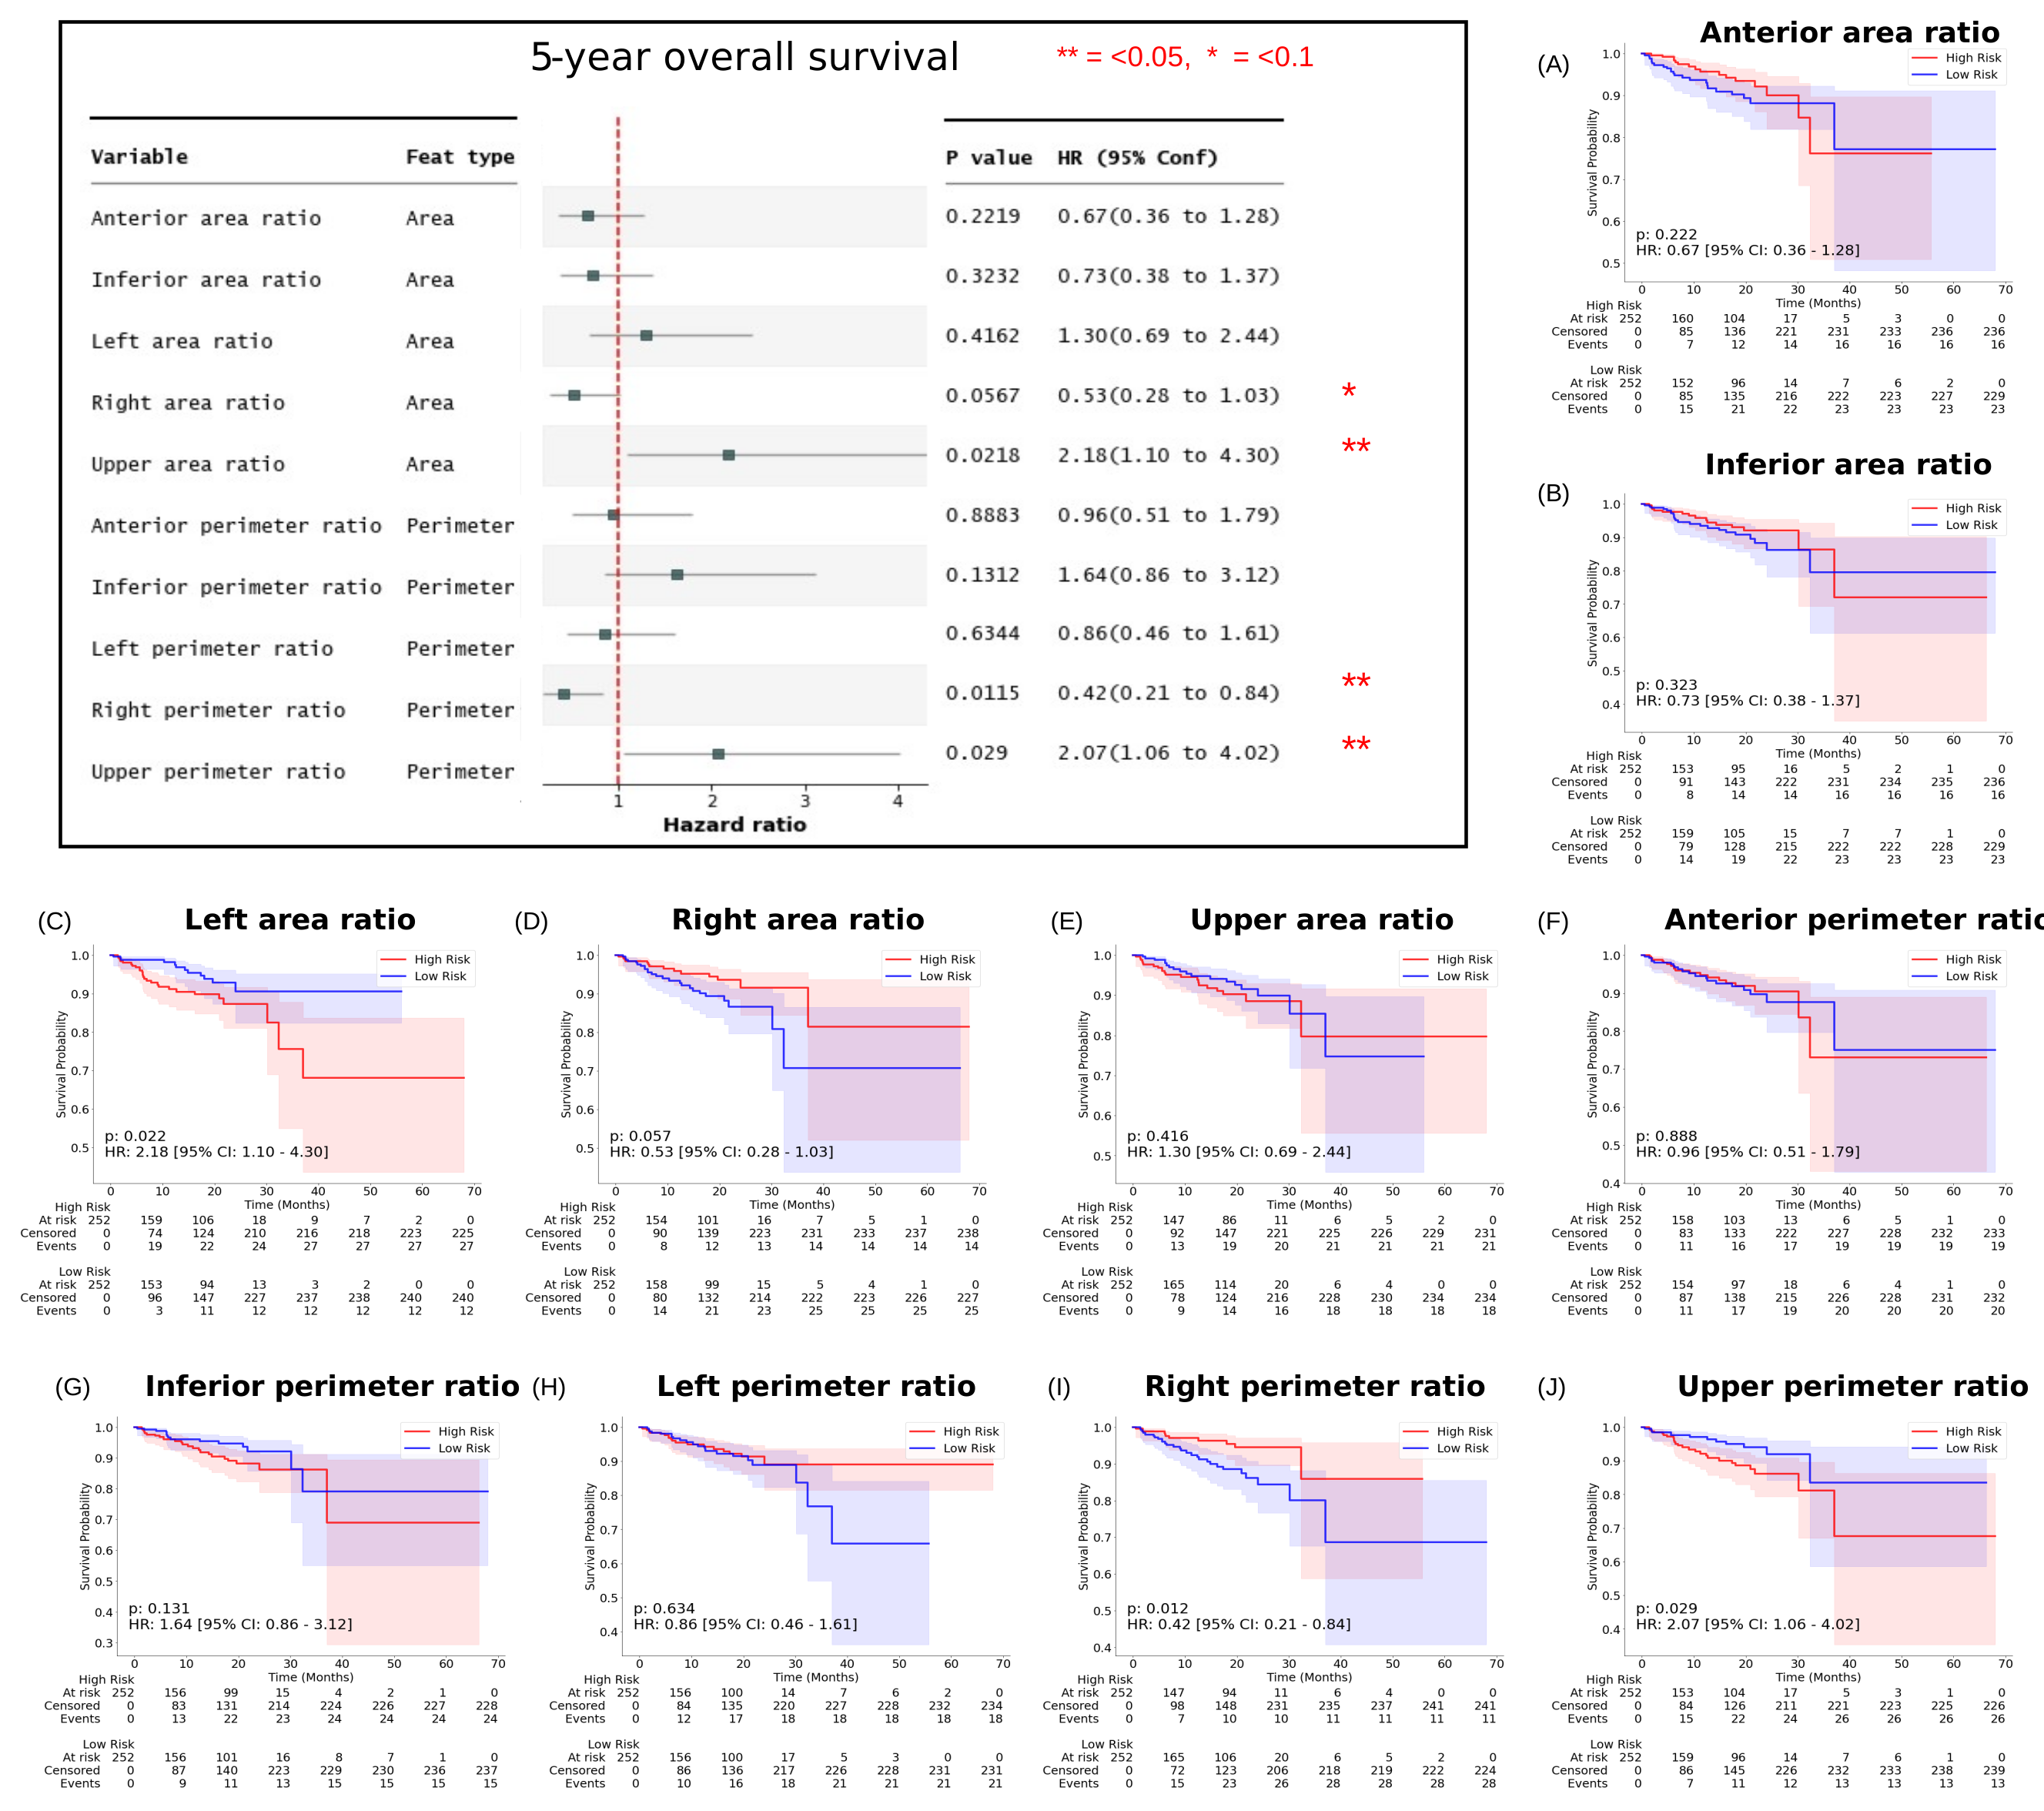
Fig. 6 — Forest plots and Kaplan–Meier curves for all-cause mortality by CardioMorph feature, TB Portals cohort, 6-month landmark analysis.
The full pipeline — registration, atlas generation, vector field analysis, and CardioMorph feature extraction — is released at
github.com/Amritpal-001/cardiomorph. It is orchestrated end-to-end by main.sh and consists of:
register_scans.py) — affine registration of every scan to a reference X-ray using signed distance fields.randomise — permutation-based group comparison across cardiac regions.gen_visualisation.py) of the resulting statistical maps.get_graph_features.py) — per-patient CardioMorph border and area features.All four datasets used in this study are publicly available (subject to their own access/use agreements) and are not redistributed in the repository:
@article{singh2026cardiomorph,
  title   = {{CardioMorph Atlas: a statistical approach to evaluate association between
             pulmonary tuberculosis and cardiac morphology from chest X-rays}},
  author  = {Singh, Amritpal and Azamat, Sena and Modanwal, Gourav and Mutha, Pushkar and
             Fu, Pingfu and Gandhi, Neel R. and Dhamdhere, Rohan and Lebowitz, Mendel and
             Al-Kindi, Sadeer and Aggarwal, Anurag and Xie, Yingda L. and Madabhushi, Anant},
  journal = {eBioMedicine},
  volume  = {130},
  pages   = {106385},
  year    = {2026},
  month   = {August},
  doi     = {10.1016/j.ebiom.2026.106385}
}
Singh, Amritpal, Sena Azamat, Gourav Modanwal, et al. 2026. “CardioMorph Atlas: A Statistical Approach to Evaluate Association between Pulmonary Tuberculosis and Cardiac Morphology from Chest X-Rays.” eBioMedicine 130 (August): 106385. https://doi.org/10.1016/j.ebiom.2026.106385.